Real Time Dashboards
The dashboard serves as the central hub of your IoT operations, allowing you to monitor your target devices effectively.
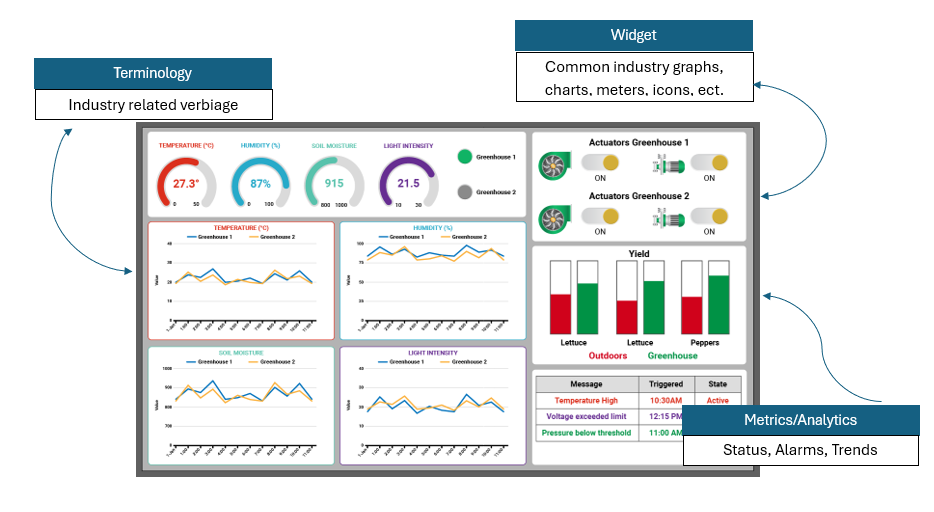
Customize your dashboard for easy visualization of live data
You can set up your dashboard to always show the same device(s) and data points, or one in which you can choose which device to view, allowing you to monitor hundreds of devices from a single dashboard. Simply select which device(s) you want to visualize, and their data will populate the widgets in real time.
Setting up your dashboard.
Here are some of the features included in Nimbus808 to make creating a dashboard easy.
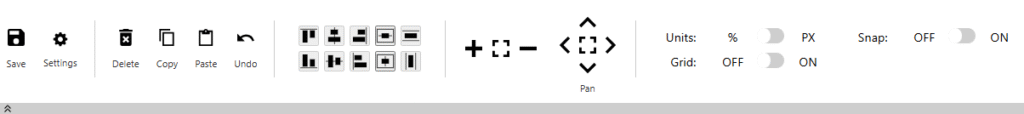
Ribbon Navigation
The ribbon is a command bar that organizes a program’s features into a series of icons at the top and sides of the screen (canvas). Nimbus808 ribbon navigation is composed of groups of closely related commands, designed to help users quickly find desired commands.
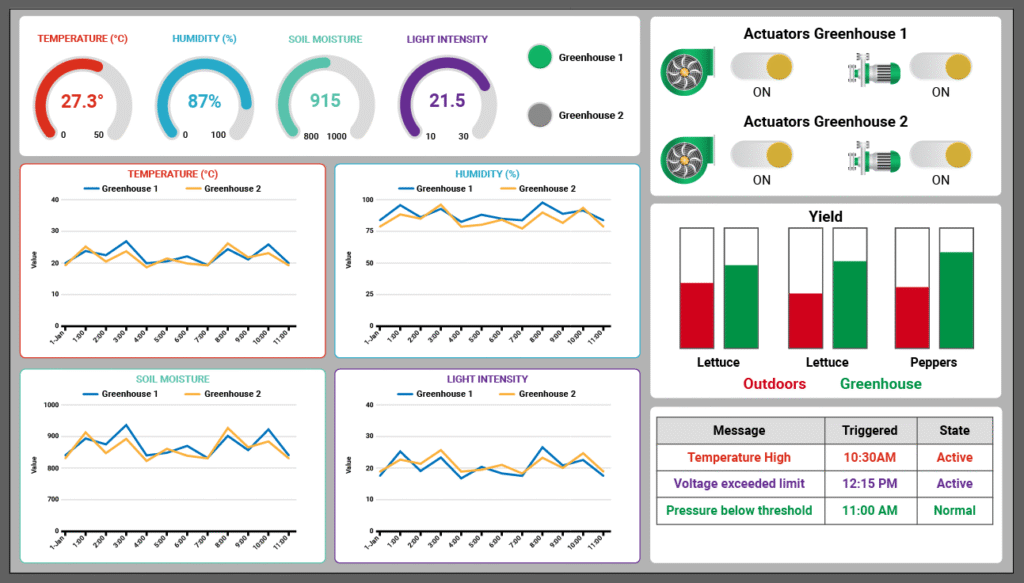
Canvas
The Canvas (highlighted in red below) is the main editing window for an open project. It displays exactly as it would appear on a screen or in a web browser.
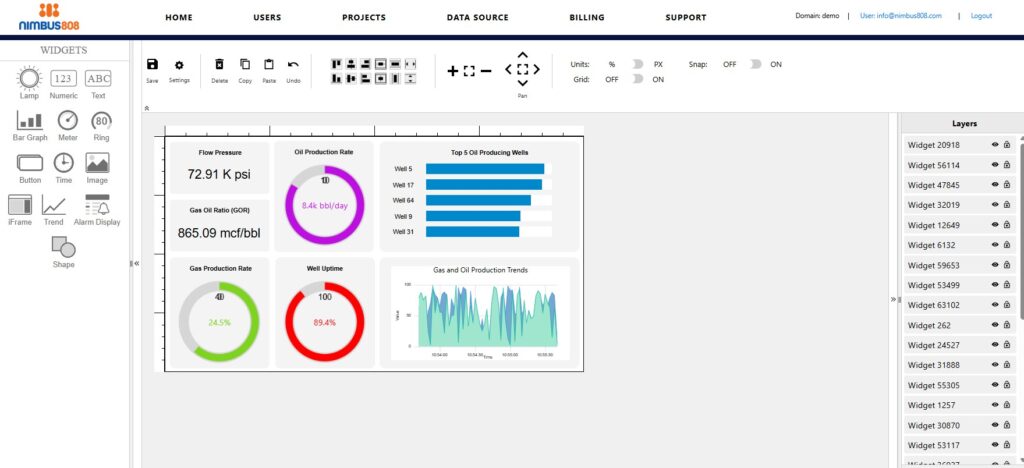
Gridlines
The gridlines outside the Canvas help users create more uniform projects by helping them align Widgets in the window.
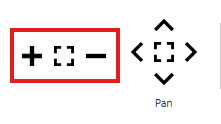
Gridline sizes can be changed by zooming in or out using Ctrl + Mouse Scroll Wheel Up/Down or by selecting the + or – icons on the Toolbar. To reset zoom, select the maximize icon that is between the + and – icons.
Templates
We’ve put together easy-to-use industry dashboard templates.
When creating your project, select the pre-made template, update the text/verbiage to meet your unique application, assign devices and tags, and set-up users.
No need to drag in widgets, format the layout, or think about colors – we’ve done all that for you.