
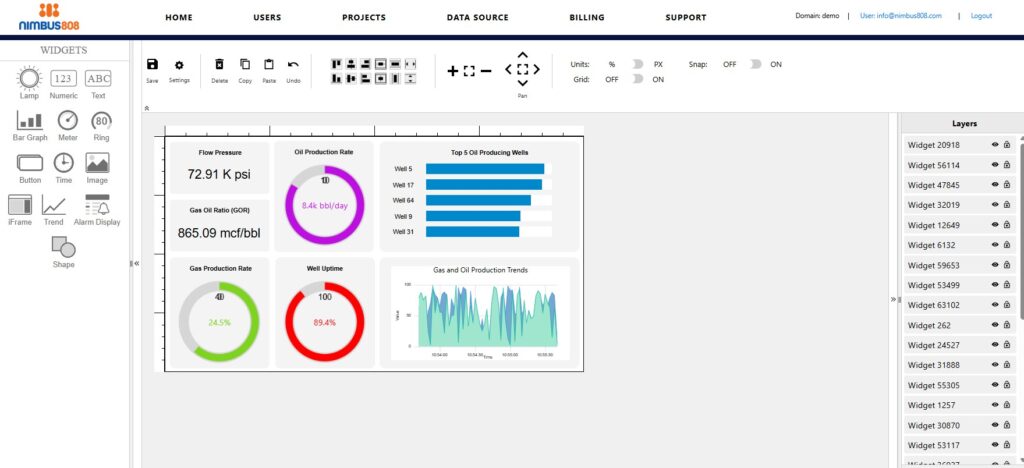
Development Environment
Easily create a dashboard and see how it would look on a screen or in a web browser.
Don’t let the simplicity fool you into thinking Nimbus808 isn’t powerful. Easily create and deploy data driven dashboards with an easy to understand user interface. All without the need to learn another complex programming language.
Nimbus808 development features:
Users Tables
The Users table lists all the users with access to the dashboard. It includes their names, roles, and emails.
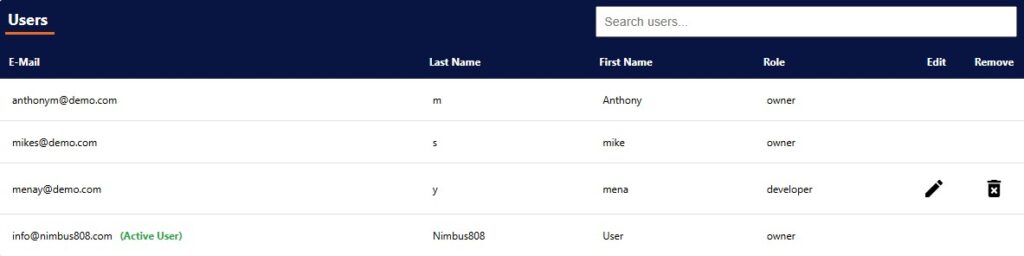
- E-mail: User’s email.
- Active User: User is online and currently interacting with the IIoT dashboard.
- Last Name: User’s last name.
- First Name: User’s first name.
- Role: User’s authorized IIoT dashboard role.
- Edit: Manage a user’s roles, settings, and information.
- Delete: Deletes the user from the IIoT dashboard.
Projects Table
The Projects page displays created projects. Authorized users can create new projects and manage existing projects. All projects are displayed in the Projects Table.
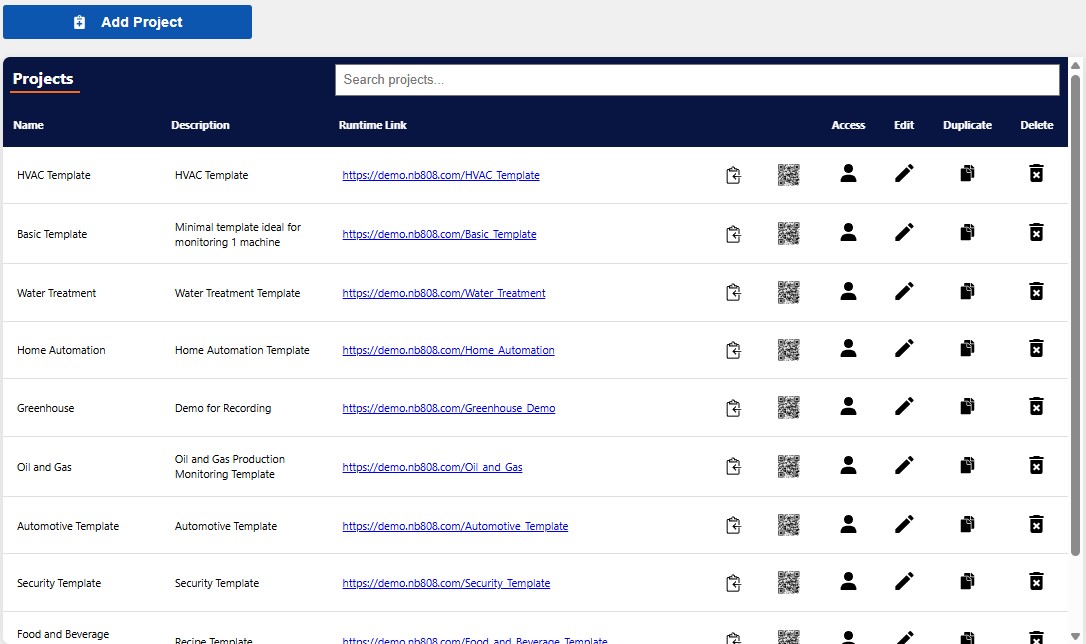
- Name: Project title.
- Description: Project overview.
- Runtime Link: Link to the runtime view for the project.
- Copy Button: Copy the Runtime Link of the project to the system clipboard.
- QR Code: Displays a QR code linking to the Runtime Link for the project.
- Access: Assign a User Group to the project.
- Edit: Links to the project’s Project Editor.
- Duplicate: Creates a project copy.
- Delete: Deletes the project
Devices Table
The Devices table shows all devices added to the dashboard. Devices are the physical hardware that powers your system, like PLCs or remote sensors.
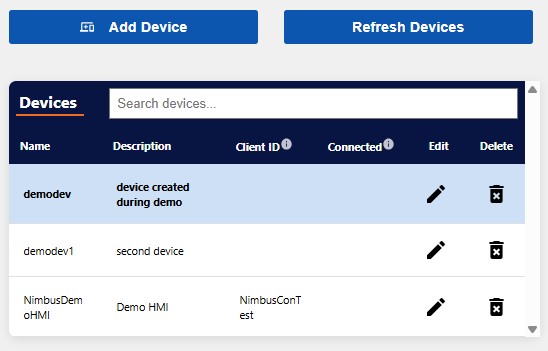
- Name: Device identification.
- Description: Device overview.
- Client Id: A unique identifier for each device that will be connected to the broker.
- Connected: A checkmark in the column indicates that a device with in the given Client ID is currently connected to the broker.
- Edit: Make edits to the Device name, description, and/or Client ID description.
- Delete: Remove device.
Tags Table
The Tags table shows all tags created for devices in the dashboard. Tags are unique, device-specific data points for communicating between the device and the Nimbus808 dashboard.
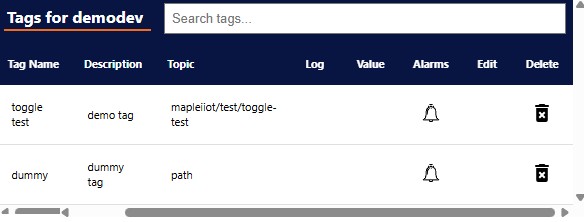
- Tag Name: Tag title.
- Description: Tag overview.
- Topic: Path to the tag within an MQTT topic.
- Log: If checked, the tag logs data to the database and can be used for historical tracking.
- Value: Current value of a tag.
- Alarms: Indicates whether the tag is associated with an alarm.
- Edit: Allows authorized users to change the tag settings.
- Delete: Remove tag.
User Management
Easily manage users, groups, and their permissions.
System administrators can invite, edit, and delete users to and from their Nimbus808 dashboard. Each invited user is also assigned a level of permissions, which determines their access to specific pages and the extent to which they can modify dashboard pages.
Groups categorize selections of users. Groups are established by the dashboard administrators or developers who have been granted access. They are commonly used to organize users based on their roles or tasks.
Project Set-up
Don’t let the simplicity fool you into thinking the program isn’t powerful. Easily create and deploy data driven dashboards with an easy to understand user interface. All without the need to learn another complex programming language.
Nimbus808 ribbon style toolbar, widget library, “layers” menu, and a main editing window called the Canvas, helps the project administrator navigate and create a dashboard exactly as it would appear on a screen or in a web browser.