Data Aggregation
Dashboards let you centralize the monitoring of many devices and visualize their data simultaneously.
Whether you’re monitoring one device or many, the Nimbus808 dashboard is easy to set-up. Add devices, configure tags, and assign data to a widget in a straight-forward set-up environment.
When setting up your dashboard, you can select multiple devices at a time to spot trends among them or easily aggregate their data. Data is represented on the dashboard depending on the type of widget (i.e., graph, chart, table, etc.) and its configuration.
Adding Device
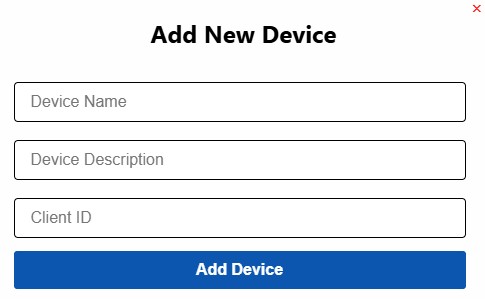
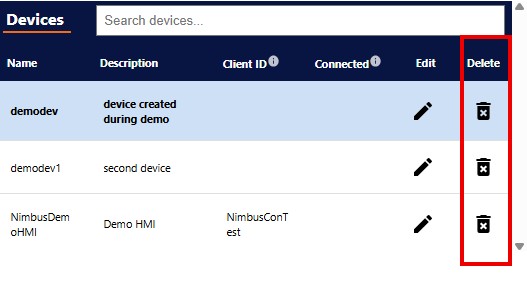
The Devices table shows the linked devices that have been added to your domain. When setting up a device, click “Add Device”, name your device and add a description to help you quickly identify devices when setting up your project.
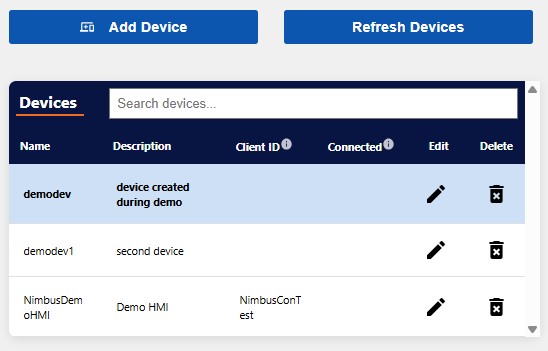
Select the Add Device button above the Devices table. A new window will appear.
Deleting Device
In the Devices table, select the waste basket icon under the Delete column in the row of the device to be deleted.
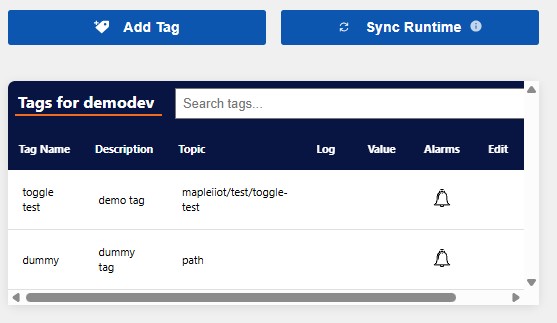
Configuring Tags
Use tags within your project to organize the data that will be displayed on your dashboards. You can set the trigger (alarm), edit, and delete tags in device specific Tags table. Assigning topics to your tag will determine if your end users get to see or interact with a specific data on your dashboard by creating tag matches between them.
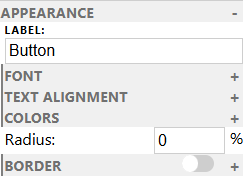
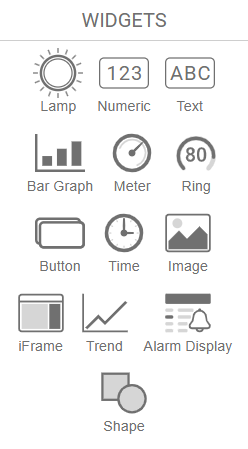
Adding Widgets
Adding widgets creates a visually aesthetic dashboard, and when laid out properly allows users to quickly find, read, and interpret data. Depending on their type, widgets will behave differently based on their configuration and the device.