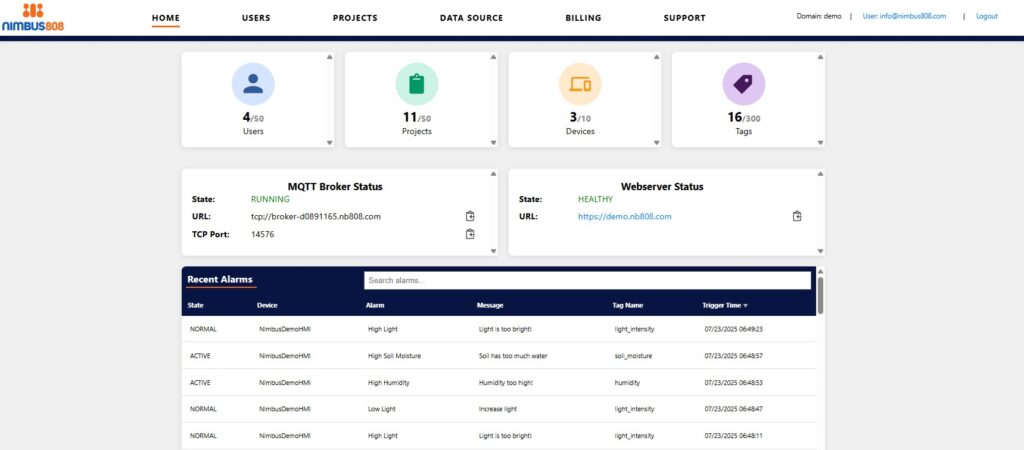
The home page provides a basic overview of the Nimbus808 dashboard, including total users, projects, devices, and tags. Quickly see broker settings and status, webserver status, and recent alarm activity.
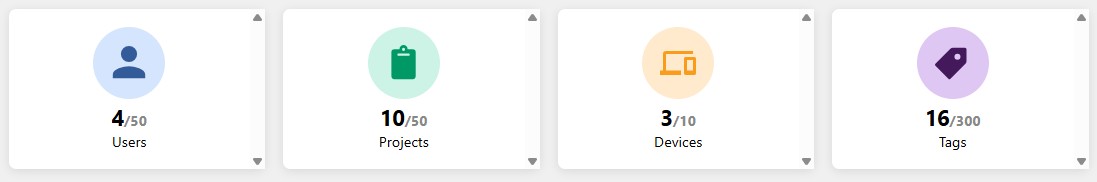
Tiles
The Tile section displays the usage, and number of users, projects, devices, and tags available with the current plan level.
Broker and Webserver Status
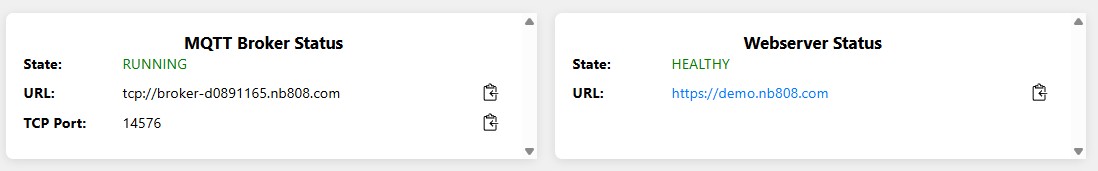
Broker Status
- State: The current state of the broker (ex: running, stopped, starting).
- URL: The URL used to connect to the broker, use this on the device supplying the data (PLC, HMI).
- Click copy icon to copy URL to clipboard.
- TCP Port: Unique port number used for traffic routing for the domain specific connection.
- Click copy icon to copy port # to clipboard
Webserver Status
- State: Healthy, Unknown, Unhealthy
- URL: URL (hyperlinked) used for accessing the live/runtime web page of your project. This is where you will actually see your data using the project the user built.
- Copy and share hyperlink for access to the project. Login information required
Recent Alarms
The Alarms panel provides information about any system alerts that have been configured.
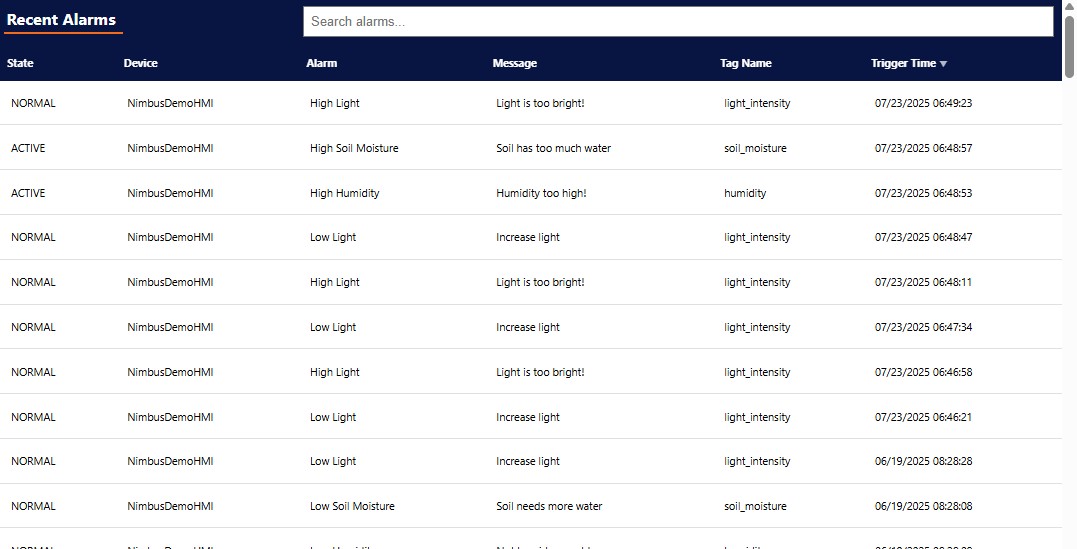
- Status: Current state of the alarm.
- Normal: Alarm is set to turn on at the specified Trigger Time.
- Active: Alarm is triggered and must be acknowledged to turn off.
- Disabled: Alarm is off and is not set to trigger.
- Device: Identifies the device that the alarm was triggered on.
- Alarm: What is the alarm topic/parameter.
- Message: The alarm message to be displayed to the user.
- Tag Name: The tag name in the device.
- Trigger time: Date and time (Year-Month-Day, Hour) when the alarm will activate.
See Alarm Conditions to set-up and manage specific tag alarms.