The Data Source page provides options and settings for defining data points to display in any created Projects. Here, users can add broker and devices, edit device information, add tags, edit tag information, and view important alarm and connection statuses.
Servers Tables
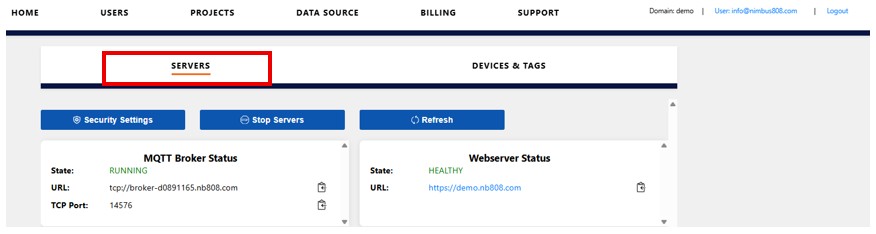
View and make edits to the brokers, copy URLs, see status of broker and webserver. See Server section for more information.
Devices & Tags Tables
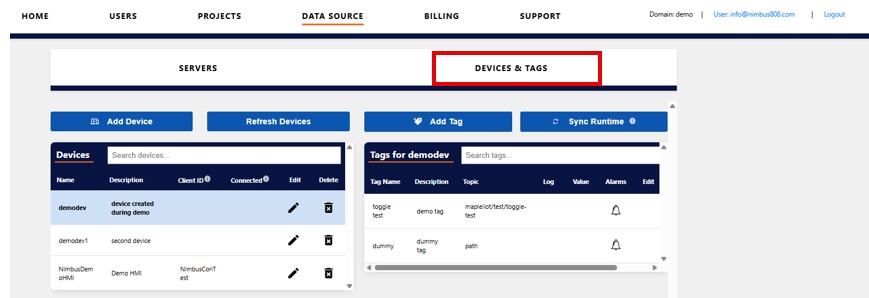
Devices Table
The Devices table shows all devices added to the dashboard. Devices are the physical hardware that powers your system, like PLCs or remote sensors.
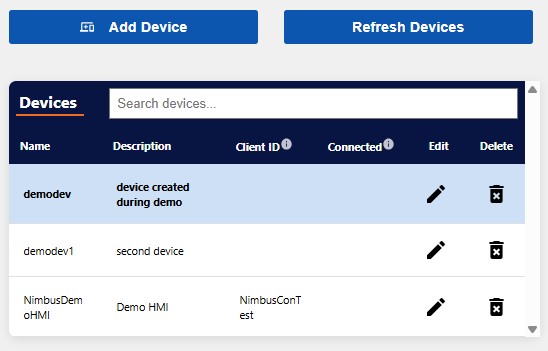
- Name: Device identification.
- Description: Device overview.
- Client ID: This is a unique identifier for each device that will connect to the broker. It is used to verify device connection status.
- Connected: A checkmark in this column indicates that a device is connected to the broker. Use the “Refresh Devices” to update the status.
- Edit: Edit device information.
- Delete: Remove device from the dashboard.
Warning: Deleted devices cannot be restored.
Tags Table
The Tags table shows all tags created for devices in the dashboard. Tags are unique, device-specific data points for communicating between the device and the Nimbus808 dashboard.
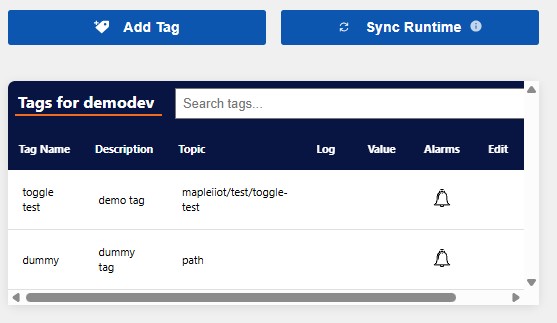
- Tag Name: Tag title.
- Description: Tag overview.
- Topic: Path to the tag within an MQTT topic.
- Log: If checked, the tag logs data to the database and can be used for historical tracking.
- Value: Current value of a tag.
- Alarms: Indicates whether the tag is associated with an alarm.
- Edit: Allows authorized users to change the tag settings.
- Delete: Remove tag.
After editing the tag list “Sync the runtime” to begin logging data and monitoring alarm states of new or updated tags.

Warning: Deleted tags cannot be restored.